
Key points
-
National average home prices were flat in May according to Cotality, the weakest since January last year. Prices fell further in Sydney and Melbourne, and the boom time cities of Brisbane, Adelaide and Perth are seeing growth slow.
-
The housing shortage and expanded 5% deposit scheme are being offset by rate hikes, low confidence & the Budget tax hikes on investors with a further fall in prices likely.
-
We now expect national average property prices to fall around 1% this year (revised from around 3% growth) and to fall around 5% over 2026-27.
-
Units and lower end property are likely to hold up better due to the expanded FHB 5% low deposit scheme. The tax changes also favour properties with higher rental yields.
-
The combination of a rising long-term trend in rates, poor affordability, the tightening of property tax concessions and a political shift towards lower immigration may mean the 30-year super cycle upswing in prices may be close to over. The housing shortage remains the key sticking point though.
-
Asking rents rose 0.6% in May, with annual growth rising to 5.9%yoy as vacancy rates remain low. This is not good for inflation.
Home price cycle turning down
Cotality data shows national average home prices were flat in May, with capital city prices down 0.1%, their second monthly fall in a row. Prices have now fallen 2.1% in Sydney and 2.9% in Melbourne from their November highs. The boom time cities of Brisbane, Adelaide and Perth are also seeing slower growth.
Australian dwelling price growth
|
|
May, % change |
Annual % change |
% chge from peak |
Median value |
|
Sydney |
-0.9 |
2.3 |
-2.1 |
$1,282,020 |
|
Melbourne |
-0.8 |
0.5 |
-3.2 |
$812,621 |
|
Brisbane |
0.9 |
19.1 |
New high |
$1,126,149 |
|
Adelaide |
0.5 |
12.3 |
New high |
$950,703 |
|
Perth |
1.5 |
25.8 |
New high |
$1,050,354 |
|
Hobart |
0.9 |
9.3 |
-1.4 |
$752,398 |
|
Darwin |
1.5 |
20.3 |
New high |
$634,368 |
|
Canberra |
-0.2 |
4.3 |
-2.1 |
$890,555 |
|
Capital avg |
-0.1 |
7.8 |
-0.3 |
$1,030,973 |
|
Regional avg |
0.6 |
11.8 |
New high |
$771,365 |
|
National avg |
0.0 |
8.8 |
New high |
$941,864 |
Source: Cotality
The broad picture remains one of a continuing slowdown since late last year reflecting a combination of rate hikes, poor affordability, depressed buyer confidence partly reflecting the oil supply shock and the Budget changes to exclude new purchases of existing properties from negative gearing and shift to the taxation of real capital gains from the 50% discount approach. Interestingly, up until Budget day the five capital city average prices were up slightly in May with all the monthly fall occurring since then suggesting the tax changes are having a significant impact. Working the other way, the boost from the expansion of the 5% low deposit scheme for first home buyers is showing up in relatively stronger conditions in lower quartile property prices and in units. They are also benefitting from poor affordability pushing buyers into lower price points.
Average capital city home prices
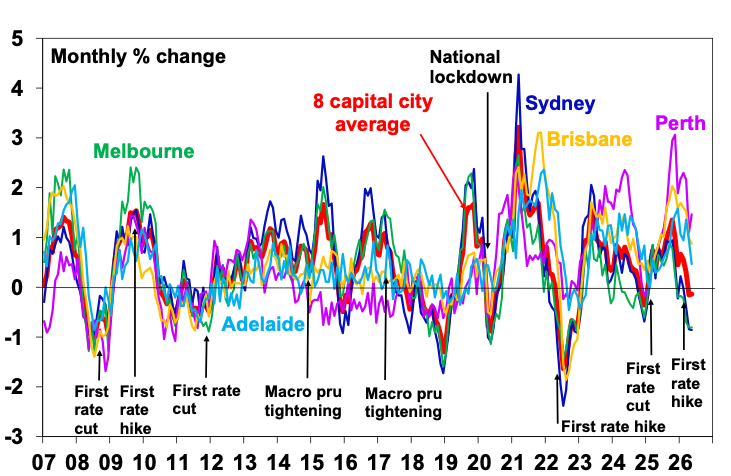
Source: Cotality, AMP
The slowdown is also evident in weak auction clearance rates.
Auction clearance rates
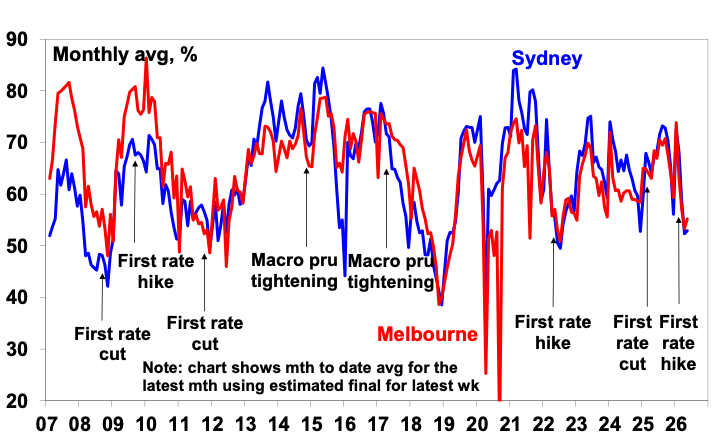
Note the chart shows a slight bounce from April to May but its seasonal. Source: Domain, AMP
Expect home prices to fall further over the next year
There are two key supports for the property market. First there remains an accumulated housing shortfall – of 200,000 to 300,000 dwellings – that has built up after years of very strong population growth. This is evident in low rental vacancy rates. Second, the expanded first home buyer 5% deposit scheme will help provide support lower priced entry level houses and units. But the bring forward of FHB demand due to the 5% deposit scheme will hit an air pocket at some point, probably next year.
However, despite these sources of upwards pressure on property prices, the Australian housing market is likely to cool further as rate hikes, already poor affordability, the impact of the War and a wind back in property tax concessions impact.
-
Rate hikes – the RBA has raised rates three times back to their prior 2023 cycle high. While it’s likely to leave rates on hold this month we expect another hike in August. Rate hikes have usually been associated with some softening in property prices or slower growth. This is because they cut how much buyers can borrow, hit confidence and can boost distressed sales. Of course, this is not always the case as other factors can intervene like the population surge in 2023 which pushed prices up despite high rates but that seems unlikely this time.
-
Poor housing affordability – the ratio of home prices to wages and incomes is at record levels. This, combined with rising mortgage rates, is leading to a widening gap between home prices and what an average buyer can afford to pay for a property.
Australian home prices versus capacity to pay
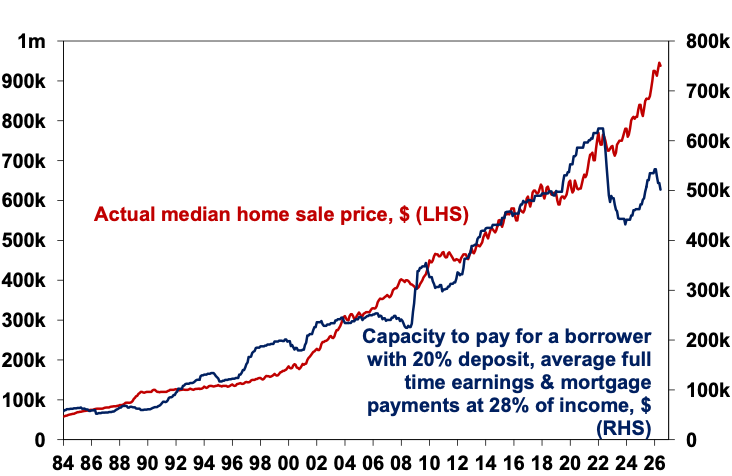
Source: Cotality, ABS, AMP
-
Poor buyer confidence – confidence has plunged as have perceptions of whether it’s a good time to buy a dwelling. The longer the Strait of Hormuz takes to return to normal the greater the risk of recession & higher unemployment, which could be a big drag on property prices.
Consumer housing sentiment and home prices
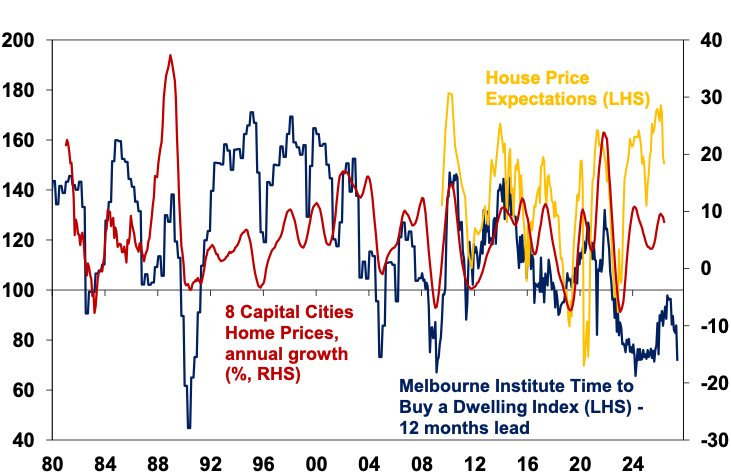
Source: Cotality, Westpac/MI, AMP
-
Tax hikes on investors – the move to remove negative gearing from new purchases of existing homes and return to the taxation of real capital gains with a minimum tax rate of 30% is likely to drive a decline in investor demand for housing in the near term. This is because the tax changes mean lower after-tax returns for investors going forward which will mean new investors will demand either lower prices or higher rents or some combination resulting in a higher starting point rental yield to make up for the less favourable tax treatment. This will be reinforced by banks reducing how much they can lend to investors due to their reduced cash flow from the tax changes. Various studies suggest this will reduce home prices by 1 to 5%. Given the risk investor sentiment weakens by more than justified by the tax changes we are assuming a 5% negative impact on property prices with the impact occurring over the next 12 months.
As a result, it’s a bit of a perfect storm for the property market. After 8.9% growth in 2025 we now anticipate a fall in national average home prices of around 1% this year and 5% over 2026-27.
However, this will likely mask a wide divergence between cities and property types. In terms of price to rent ratios adjusted for inflation as a rough guide to whether the market is over or under valued – a bit like the PE for shares – houses are 36% overvalued compared to units at just 9% and so are far more vulnerable to a fall in prices. See the next table. And units are likely to be supported by FHBs using the 5% deposit scheme. Using the same approach – in terms of houses Brisbane, Sydney and Adelaide are the most overvalued and vulnerable and in terms of units Brisbane, Adelaide and Canberra units are the most vulnerable.
Percent overvaluation relative to long term price and rent ratios
|
City |
Houses |
Units |
|
Sydney |
42 |
3 |
|
Melbourne |
22 |
0 |
|
Brisbane |
57 |
33 |
|
Adelaide |
40 |
30 |
|
Perth |
25 |
6 |
|
Hobart |
37 |
15 |
|
Canberra |
29 |
30 |
|
Capital city average |
36 |
9 |
Note – price to rent ratios are adjusted for inflation. Source: REIA, AMP
Is the super cycle upswing in property prices over?
Since the mid-1990s Australian property prices have been in a long term, or super cycle, upswing. The next chart shows real home prices (average property prices after removing increases in inflation) indexed to start in 1926 at 100 (red line) against their long-term trend (blue line).
Real Aust house prices are well above their long term trend
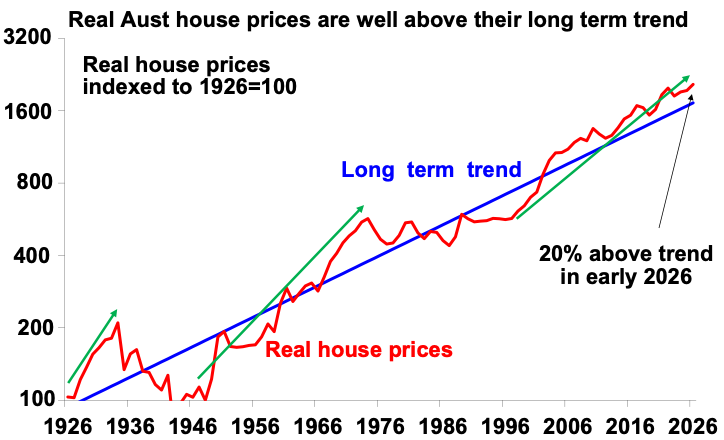
Source: ABS, AMP
Over the last 100 years real property price growth has averaged around 3% per annum which is in line with long term average real GDP growth (which is a rough proxy for real income growth). We can see that real Australian property prices have gone through three major long-term (or super cycle) booms (highlighted with green arrows) and two major long-term busts or weak periods over the last century.
-
The first long term boom was in the 1920s and was associated with an economic boom and very strong population growth from the end of WW1 until the early 1930s. See the first circled area in the next chart showing population growth.
-
This was followed by a collapse in property prices associated with the Depression, a plunge in population growth and the early years of WW2, with real prices not bottoming until 1943 – maybe after many in Sydney’s Eastern suburbs sold up after the 1942 midget sub attack!
-
The second long-term boom got underway after WW2 and ran into the early 1970s supported by very strong economic and population growth (the second circled area in the population chart). This saw real property prices rise from 50% below their long-term trend to be 50% above trend by 1973.
Australian population growth
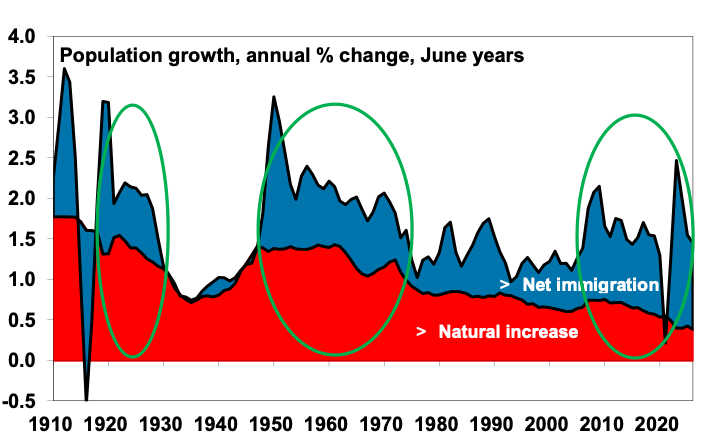
Source: ABS, AMP
-
This long boom ended in the mid-1970s with the economic malaise of the time, a step down in population growth and the high interest rates of the 1980s. Unlike the collapse of the first long-term boom, it saw real house prices churn sideways in a wide range with some strong periods along the way (such as in 1988-89). But because of a 20 year plus churn in real house prices, by the mid-1990s real prices were more than 20% below their long-term trend and little different to where they were in the mid-1970s. This was a great time to get into Australian property!
-
This set the scene for the start of the current long-term boom in property prices in the second half of the 1990s, that has taken real property prices from well below trend to around 20% above trend.
-
The super cycle upswing in real property prices over the last thirty years has been propelled by a combination of:
-
the shift from high mortgage rates – they were 17% in the late 1980s/very early 1990s – to low rates of 2-3% a few years ago, which enabled buyers to borrow more and hence pay more for homes;
-
the easier availability of home loans with financial deregulation;
-
the growth of two income households adding to how much buyers could borrow and pay each other for homes;
-
a surge in underlying demand for housing as a result of a surge in population growth on the back of high immigration levels starting around 20 years ago which has continued albeit with a brief pause in the pandemic (see the third circled area in the last chart); and
-
Some would say the shift to taxing 50% of capital gains from taxing real capital gains in 1999 which combined with negative gearing and high marginal tax rates to boost investor demand for property.
-
This combined all goes a long way to explain how Australian housing went from cheap in the mid-1990s to expensive in the early 2000s and has stayed there ever since, in fact becoming more so. This can be seen in the surge in house price to wage and income ratios since the 1990s.
Ratio of home prices to wages and incomes
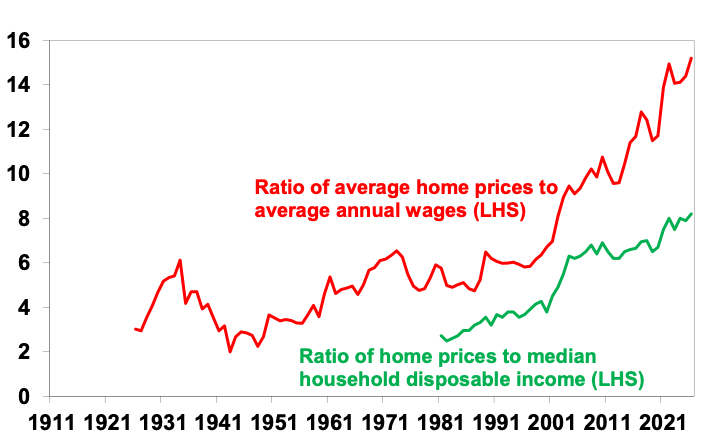
Source: ABS, Cotality, AMP
The main drivers have been the combination of low rates and an undersupply of property where people wanted to live (big cities). Other countries have had low rates and tax breaks too, but they have kept housing more affordable because of a better supply/demand balance.
The last two long booms or super cycle upswings were bought to an end by Depression and severe stagflation which hopefully won’t be the case this time. However, there are some reasons to believe that the long-term boom in Australian property prices may be close to an end as some of its drivers are starting to fade or have run their course:
-
First, the long-term decline in mortgage rates that started in the 1990s and continued to 2020 when mortgage rates hit 2-3% looks to have bottomed. Rates rose in 2022-23, there was a brief and modest fall last year but now they are on the way back up again. For various reasons we now appear to have entered a more inflation prone world which means higher rates. So, the trend to ever lower mortgage rates driving ever higher amounts of money people can borrow enabling ever higher home prices may be over.
-
Second, two income families are now the norm and so the boost from the move to this likely doesn’t have much further to go.
-
Third, immigration is trending down with the Government forecasting a fall to 225,000 pa, the Coalition talking of 165,000 or so & One Nation talking of 130,000 with an aspiration of net-zero.
-
Finally, the tax concessions for investors have been curtailed.
Calls for an imminent end to the property super cycle need to be treated with some caution though. I thought it might be close to over five years ago, but it was extended by a surge in immigration coming out of the pandemic and constrained home building resulting in a chronic undersupply of housing. Another surge in immigration is unlikely, but a 200,000 to 300,000 housing shortage remains. And with home building running around 180,000 a year and likely to slow in response to rate hikes it’s likely to remain well below the Housing Accord target of 240,000 a year which is necessary to meet annual housing demand and eat into the accumulated undersupply. So, at this stage while many of the conditions are falling into place it may be premature to call an end to the home price super cycle boom of the last 30 years until the supply shortfall comes under better control.
What to watch?
The key things to watch with respect to the next 12 months will be interest rates, the Strait of Hormuz, unemployment and investor demand in response to the tax hikes. Several more rate hikes, a sharply rising trend in unemployment and a big drying up in investor demand could result in much bigger price falls than 5%. On the flip side a quick resumption of rate cuts, a quick resolution of the oil supply shock and a subdued investor response could drive stronger property prices next year. Overall, the risks for home prices over the next 6-12 months seem skewed on the downside but note that in the absence of much higher unemployment, forecasts for a property price crash (say a 15-20% fall or more) are likely to be wide of the mark. A crash would require wide scale forced selling by homeowners – but without much higher unemployment forcing homeowners to sell this is unlikely as Australians will do whatever they can to keep servicing their mortgage.
In terms of the 30-year super cycle upswing – many of its key drivers are now fading but the supply shortfall is key. If it closes quickly thanks to stronger supply or a faster fall in immigration, then the super cycle upswing may well be over.
Dr Shane Oliver – Head of Investment Strategy and Chief Economist, AMP
Important note: While every care has been taken in the preparation of this document, AMP Capital Investors Limited (ABN 59 001 777 591, AFSL 232497) and AMP Capital Funds Management Limited (ABN 15 159 557 721, AFSL 426455) make no representations or warranties as to the accuracy or completeness of any statement in it including, without limitation, any forecasts. Past performance is not a reliable indicator of future performance. This document has been prepared for the purpose of providing general information, without taking account of any particular investor’s objectives, financial situation or needs. An investor should, before making any investment decisions, consider the appropriateness of the information in this document, and seek professional advice, having regard to the investor’s objectives, financial situation and needs. This document is solely for the use of the party to whom it is provided.